⚡ Storm or Roof Damage? Get a FREE Estimate
Text ESTIMATE to (844) 907-2546
Or call (800) 792-0212 for 24/7 emergency response
AI-powered • No obligation • Licensed IL & WI
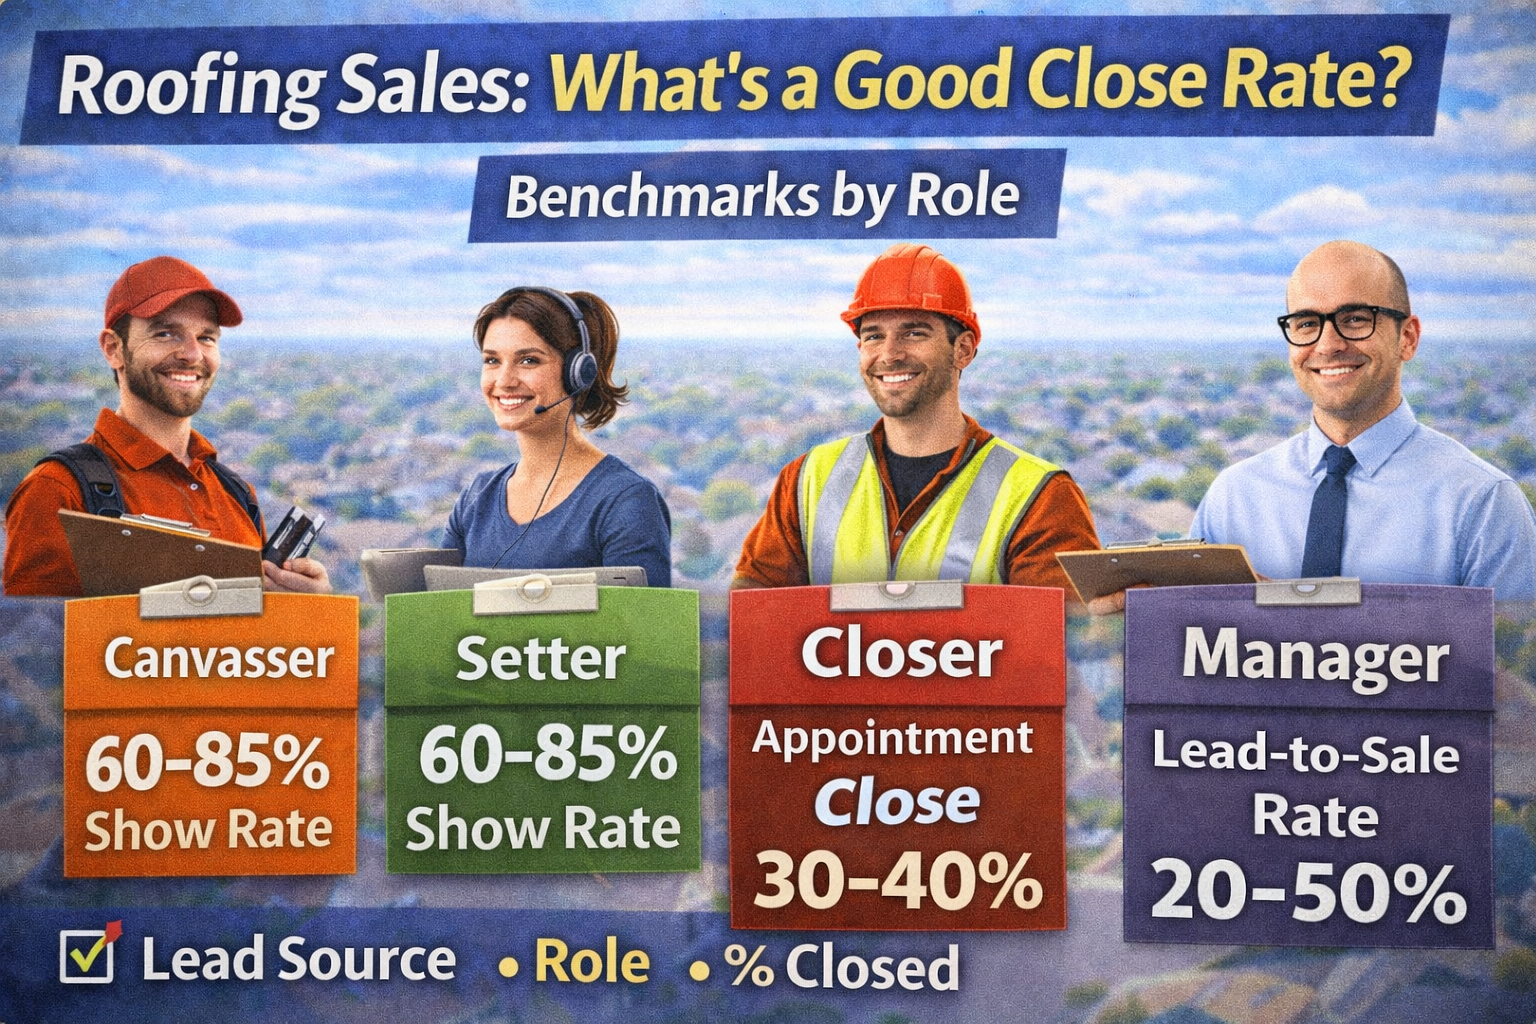
If you’re in roofing sales, “close rate” can mean a lot of different things. A canvasser might call it a set rate. A closer might mean appointments-to-signed-jobs. A manager might track lead-to-sale across the whole team.
This 2026 guide breaks down good close-rate benchmarks by role, shows what ranges are realistic based on lead source, and gives you a simple way to measure (and improve) your numbers.
First: define which close rate you’re talking about
Most roofing companies should track close rate at two levels:
1) Appointment Close Rate (most common for closers)
Appointments (or inspections) ran → signed jobs
Industry benchmarks commonly land around:
- ~27% at larger roofing companies (often cited as a “big company” benchmark)
- ~30–40% as a “good” close rate on qualified roofing appointments
2) Lead-to-Sale Close Rate (what owners should care about)
Leads → signed jobs
This varies heavily by lead quality. Some sources cite 10–20% for third-party leads and 50%+ for referrals.
Benchmarks by role in roofing
A) Canvasser (Door-to-door lead gen)
A canvasser usually isn’t “closing deals.” Their win is producing quality appointments that actually happen.
Track these instead of “close rate”:
- Contact rate: doors knocked → conversations
- Set rate: conversations → appointments set
- Show (sit) rate: appointments set → appointments kept
Practical targets (most teams):
- Contact rate: 10–25% (higher in tight subdivisions / good hours)
- Set rate: 15–35% of conversations (depends on storm relevance + script)
- Show rate: 60–85% with strong confirmation process (text + call + reminder)
Why “show rate” matters: if your sets don’t sit, your team will argue forever about “quality.” Many appointment-setting KPI guides emphasize show rate as a core performance health indicator.
B) Appointment Setter (Remote or inbound/outbound)
Setters win by producing qualified meetings/inspections that show up.
Key benchmarks to watch:
- Connect rate (if outbound)
- Set rate (connect → appointment)
- Show rate (appointment kept)
General appointment-setting benchmarks vary widely by industry, list quality, and whether you’re calling cold vs warm leads. One benchmark write-up in industrial/B2B sales cites connect rates commonly around 10–15% and connect-to-meeting conversion around ~2.3% (cold outbound context).
For roofing, warm inbound will typically outperform cold outbound—so judge setters based on qualified sits more than raw dials.
C) Closer / Sales Rep (Inspector)
This is the role people mean when they ask “what’s a good close rate?”
Benchmarks (appointments ran → signed jobs):
- 20–30% is often considered solid for outbound/colder lead sources in contractor sales broadly
- ~27% is frequently cited as a “large-company” roofing benchmark
- 30–40% is commonly cited as a “good” roofing close rate on qualified leads
- 50%+ happens on strong referral pipelines (but it’s not the norm for cold leads)
Important reality check: If someone claims 60–80% on “cold” storm leads, either they’re in a very unusual market, the definition of “lead” is extremely tight, or pricing/qualification is doing most of the work.
D) Sales Manager (Team close rate)
A manager shouldn’t obsess over one close rate. They should own the funnel.
Team benchmarks to track:
- Lead → appointment set
- Appointment set → appointment sat (show rate)
- Appointment sat → signed job (close rate)
- Signed job → completed job (cancellation rate)
If your close rate is good but cancellations are high, you don’t have a sales problem—you have a handoff/operations problem.
Benchmarks by lead source (this is why reps argue)
Close rate is heavily determined by where leads come from:
- Referrals: often the highest (commonly cited 50%+ in discussions)
- Self-generated D2D storm: mid-range (depends on storm relevance + script + speed)
- Paid third-party leads: often lower; some sources cite 10–20%
- Inbound SEO/GBP: can be strong, but depends on trust signals and follow-up speed
So always compare close rates within the same lead source, not across totally different pipelines.
A simple way to measure your close rate correctly
For closers:
Close Rate = Signed Jobs ÷ Appointments Sat
Example: 12 sales ÷ 40 sits = 30%
For canvassers/setters:
Show Rate = Appointments Sat ÷ Appointments Set
Example: 34 sits ÷ 50 sets = 68%
Then multiply to understand the full pipeline:
Set → Sit → Sold
- 50 sets → 34 sits (68% show) → 10 sales (29% close)
Overall: 10 ÷ 50 = 20% set-to-sale
What to do if your close rate is “too low”
If you’re below ~20% on appointments sat (and you’re not dealing with junk leads), it usually comes down to:
- weak qualification (wrong homeowner, not decision-maker, no urgency)
- inconsistent follow-up
- unclear estimate presentation
- trust issues (proof, reviews, process)
- slow response time after lead comes in
A lot of roofing operators point out close rate isn’t just “pitch”—it’s the entire process.
Quick FAQs
Is 30% a good close rate in roofing?
Often yes—many sources cite 30–40% as a good range on qualified roofing appointments, with ~27% commonly referenced as a large-company benchmark.
What’s a good close rate for storm leads?
It depends on how “storm lead” is defined. If it’s truly cold D2D, many teams land in the 20–35% range on sat appointments when the area was actually hit and qualification is strong (and much lower when it wasn’t).
What matters more than close rate?
If you’re building a team: show rate + cancellation rate + gross margin. A rep can “close” deals that never install—those aren’t wins.
Want help diagnosing your numbers?
Allied Emergency Services, Inc.
Phone: 800-792-0212
Email: info@alliedemergencyservices.com
Apply: https://www.careers.alliedemergencyservices.com/jobs
⚡ Need Storm Damage Help? We Serve 155+ Cities
Allied Emergency Services provides 24/7 emergency restoration across Illinois, Wisconsin, Indiana, and Michigan. Text ESTIMATE to (844) 907-2546 for a free estimate in minutes.
Top service areas: Chicago • Naperville • Aurora • Kankakee • Joliet • Rockford • Schaumburg • Milwaukee • Madison • We’re Hiring!
⚡ Storm or Roof Damage? Get a FREE Estimate
Text ESTIMATE to (844) 907-2546
Or call (800) 792-0212 for 24/7 emergency response
AI-powered • No obligation • Licensed IL & WI