⚡ Storm or Roof Damage? Get a FREE Estimate
Text ESTIMATE to (844) 907-2546
Or call (800) 792-0212 for 24/7 emergency response
AI-powered • No obligation • Licensed IL & WI
If you want predictable revenue in roofing, you don’t “hope” your sales team performs—you manage the numbers. The right roofing sales KPIs tell you exactly where the funnel is leaking and what to fix first.
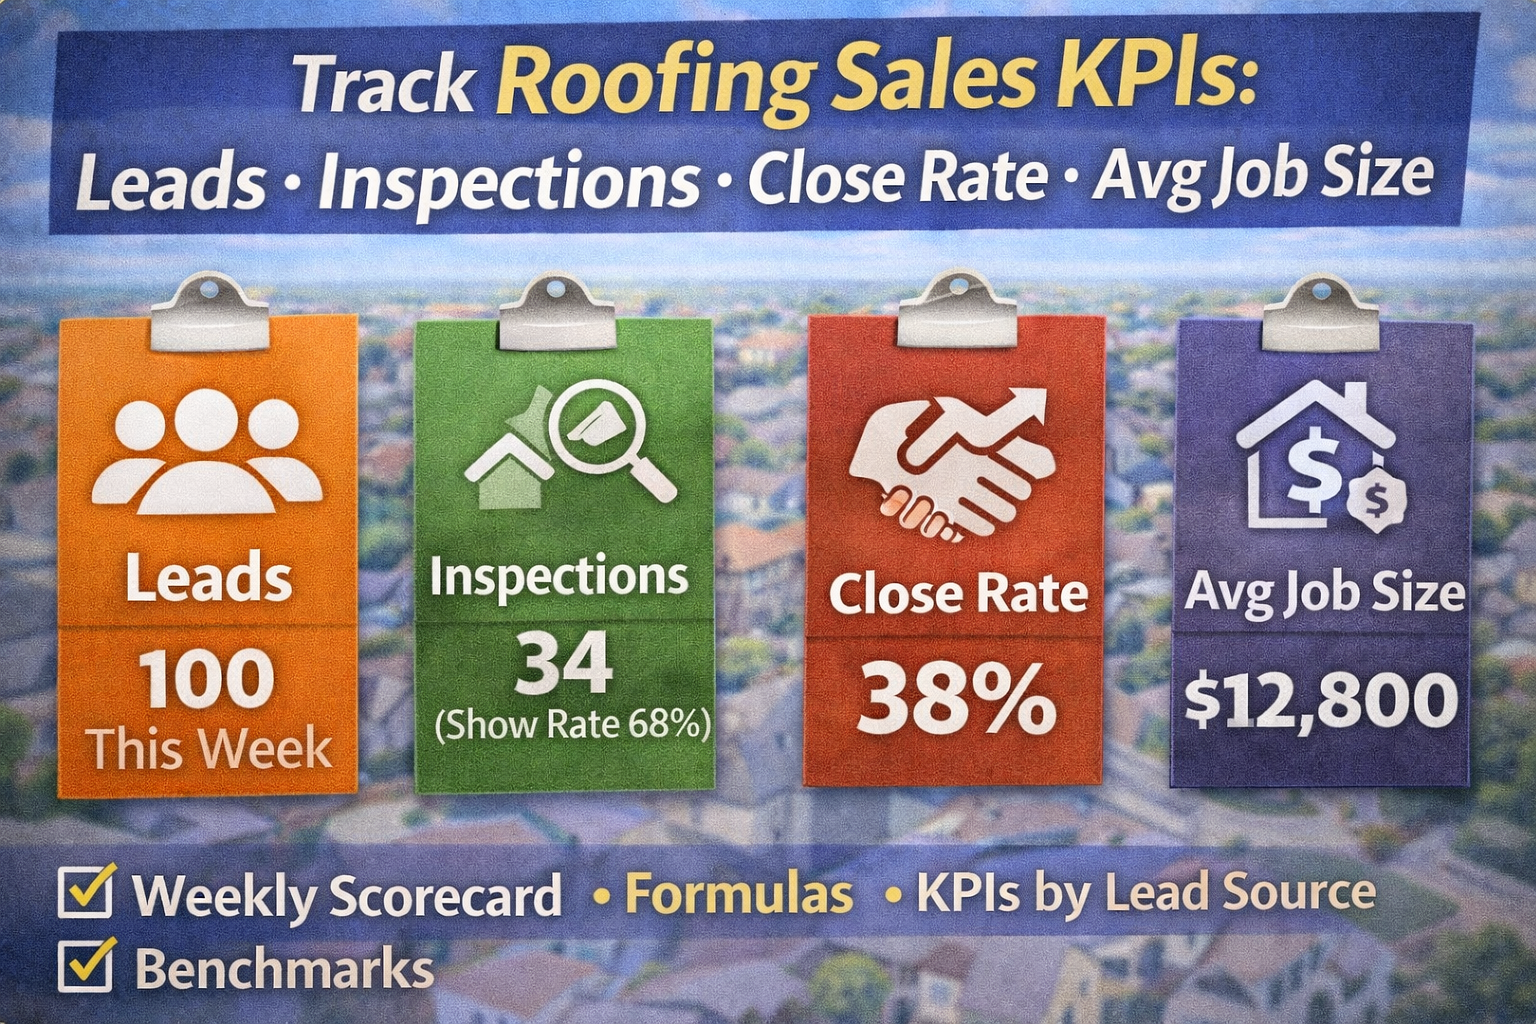
This guide covers the core metrics every roofing company should track in 2026:
- Leads
- Inspections (appointments set + sat)
- Close rate
- Average job size
…and the supporting KPIs that actually move them.
The roofing sales funnel (the only model you need)
Leads → Inspections Set → Inspections Sat → Sold Jobs → Completed Jobs
Most teams obsess over “sales,” but the fastest improvements come from fixing the earliest weak link (usually speed to contact, show rate, or follow-up).
KPI #1: Leads (by source)
What to track
- Lead volume (weekly/monthly)
- Lead source mix (D2D, referral, SEO/GBP, paid ads, LSA, vendor leads, repeat clients)
- Cost per lead (CPL) for paid sources
- Lead response time (how fast you contact them)
Why it matters
Leads are the fuel for everything else. But not all leads are equal—your close rate and job size will vary by source, so track them separately.
Minimum dashboard fields
- Date created
- Source
- Status (new/working/closed)
- Assigned rep
- First contact attempt time
- Outcome
KPI #2: Inspections (appointments) — Set vs Sat
This is where most roofing teams either win big or bleed out quietly.
Definitions
- Inspections Set = appointments scheduled
- Inspections Sat (Show/Sit) = appointment actually happened (rep met homeowner / accessed roof)
Formulas
- Set Rate = Inspections Set ÷ Leads
- Show Rate (Sit Rate) = Inspections Sat ÷ Inspections Set
Why it matters
A lot of “lead gen” is really just calendar noise. Show rate tells you if appointments are real.
What moves show rate
- Same-day confirmation text
- Reminder the night before
- Reminder 1–2 hours before
- Clear “what to expect” message (time window, inspector name, parking notes)
KPI #3: Close Rate (the correct way)
Definition (most useful)
- Close Rate = Sold Jobs ÷ Inspections Sat
Why sat appointments? Because it isolates sales performance from lead quality and no-shows.
Supporting metrics
- Lead-to-sale rate = Sold Jobs ÷ Leads (good for owners/managers)
- Quote rate = Quotes Delivered ÷ Inspections Sat (if you’re losing people before you even present)
Fixes if close rate is low
- Qualification problems (wrong decision-maker, wrong expectations)
- Weak inspection documentation (no photos, vague findings)
- Poor estimate presentation (too fast, too technical, no options)
- Follow-up gaps (no scheduled next step)
KPI #4: Average Job Size (AJS)
Formula
- Average Job Size = Total Sold Revenue ÷ # Sold Jobs
Why it matters
You can grow revenue without adding more leads by improving:
- Scope clarity
- Add-on attach rate (gutters, vents, skylights, siding, fascia/soffit)
- Better estimating discipline
- Cleaner supplements/change orders (when applicable)
Track AJS by:
- Rep
- Lead source
- Job type (retail vs insurance restoration)
- Neighborhood/territory
The 4 “support KPIs” that control everything
1) Speed to Contact
Fast follow-up dramatically improves appointment rate. Track:
- Median minutes to first call/text
- % contacted within 5/15/60 minutes (for inbound leads)
2) Touches per Lead
Most reps quit too early. Track:
- calls + texts + emails per lead until disposition
3) Cancellation Rate
A “sale” isn’t a win if it cancels.
- Cancellation Rate = Canceled Jobs ÷ Sold Jobs
If cancellations are high, look at expectation setting, pricing clarity, timeline, and production handoff.
4) Gross Margin (if you can)
If your comp plan is profit-based or you care about sustainable growth, margin is non-negotiable:
- margin by rep, by source, by job type
KPI targets that are realistic (use as a starting point)
These vary by market and lead source, but here are practical ranges many teams use to sanity-check performance:
- Show rate (sits): 60–85%
- Close rate on sat appointments: 20–40% (higher on referrals, lower on cold sources)
- Cancellation rate: keep it as low as possible; spikes usually signal ops/handoff issues
- Avg job size: depends on your mix—track and improve it, don’t compare to others blindly
Your best benchmark is your own last 90 days—then improve one lever at a time.
A simple weekly KPI scorecard (copy/paste)
Team (weekly):
- Leads received: ___
- Inspections set: ___ (Set Rate: __%)
- Inspections sat: ___ (Show Rate: __%)
- Sold jobs: ___ (Close Rate: __%)
- Revenue sold: $___ (Avg Job Size: $___)
- Cancellations: ___ (Cancel Rate: __%)
Per rep (weekly):
- Leads assigned: ___
- Sits: ___
- Sold: ___
- Revenue: $___
- Close rate: __%
- Notes quality score (manager review): ___/10
How to implement KPI tracking fast (without overcomplicating)
- Pick one CRM and enforce usage
- Standardize pipeline stages (no custom stages per rep)
- Require 5–7 required fields per lead (source, status, appointment date/time, etc.)
- Run a weekly pipeline review
- Coach one KPI per week (not ten)
KPI tracking only works if reps trust the system—and managers actually use it.
Want a KPI dashboard built for your team?
Allied Emergency Services, Inc.
Phone: 800-792-0212
Email: info@alliedemergencyservices.com
⚡ Need Storm Damage Help? We Serve 155+ Cities
Allied Emergency Services provides 24/7 emergency restoration across Illinois, Wisconsin, Indiana, and Michigan. Text ESTIMATE to (844) 907-2546 for a free estimate in minutes.
Top service areas: Chicago • Naperville • Aurora • Kankakee • Joliet • Rockford • Schaumburg • Milwaukee • Madison • We’re Hiring!
⚡ Storm or Roof Damage? Get a FREE Estimate
Text ESTIMATE to (844) 907-2546
Or call (800) 792-0212 for 24/7 emergency response
AI-powered • No obligation • Licensed IL & WI